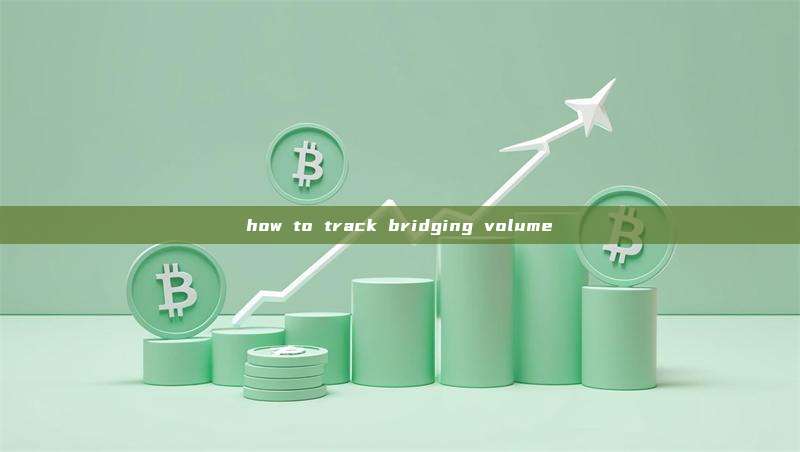
Tracking bridging volume is crucial for monitoring cross-chain activity. Here are the main approaches:
1. Block Explorer-Based Tracking
Cross-Chain Bridges
LayerZero Scan:
scan.layerzero.networkWormhole Explorer:
wormholescan.ioMultichain (Anyswap):
app.multichain.orgAxelarscan:
axelarscan.ioCeler cBridge:
cbridge.celer.networkAcross:
explorer.across.to
Bridge Aggregators
Socket:
socket.techLI.FI:
li.fiBungee:
bungee.exchange
2. Analytics Platforms
General Analytics
DefiLlama Bridges:
defillama.com/bridgesTracks TVL and volume for 70+ bridges
Historical data and trends
Dune Analytics Dashboards
Search for specific bridge dashboards
Create custom queries
Token Terminal
Artemis
Chain-Specific
Ethereum: Dune, Etherscan
Polygon: Polygonscan
BNB Chain: BscScan
Arbitrum, Optimism: respective block explorers
3. Key Metrics to Track
Volume Metrics
Daily Bridging Volume: Total value moved cross-chain
Net Flow: Directional flow between chains
Unique Users: Number of bridging addresses
Transaction Count: Number of bridge transactions
Financial Metrics
TVL Locked in Bridges
Bridge Fees Collected
Average Transaction Size
4. API Access
Direct Bridge APIs
Many bridges offer APIs:
// Example: LayerZero API
GET https://api.layerzero.network/volume
Third-Party APIs
Covalent: Unified API for multiple bridges
Flipside Crypto
Space and Time
5. Creating Custom Trackers
Using Dune Analytics
-- Example query for bridge volume
SELECT DATE(block_time) as day,
SUM(usd_value) as daily_volume,
COUNT(*) as tx_count
FROM bridge_transactions
WHERE bridge = 'your_bridge'
GROUP BY 1
Using The Graph
Many bridges have subgraphs
Query historical data programmatically
6. Real-Time Monitoring
Alerts Setup
Telegram/Discord Bots: For large transactions
Set Threshold Alerts: Unusual volume spikes
Competitor Monitoring: Track rival bridge volumes
Dashboard Tools
Grafana with blockchain data sources
Google Data Studio
Custom web dashboards
7. Specialized Use Cases
For Investors
Track bridge adoption trends
Fee revenue analysis
Market share changes
For Developers
Monitor integration performance
User behavior analysis
Gas optimization tracking
For Researchers
Cross-chain money flow studies
Bridge security analysis
Regulatory compliance tracking
8. Best Practices
Multiple Sources: Cross-verify data from different platforms
Historical Context: Compare with previous periods
Segmentation: Analyze by token, chain pair, user type
Anomaly Detection: Watch for unusual patterns
Regular Reporting: Set up weekly/monthly reports
9. Common Pitfalls
Double-counting (same asset bridged multiple times)
Missing private/burn-mint bridges
Price oracle discrepancies
Including fake/farm volume
Tip: For comprehensive tracking, combine DefiLlama for high-level overview with Dune Analytics for granular, custom analysis specific to your needs.